
The "Voting vs. Weighing" Narrative: Disrupting the AI Bear Narrative: Constellation Software Breaks Out
A Technical Overview


In late July, I laid out a high-conviction bullish thesis for Constellation Software (CSU/CNSWF), anchored in deep fundamental analysis, historical valuation troughs, and key institutional metrics. At the time, short-term market sentiment was severely weighed down by macro narratives surrounding AI-driven disruption in vertical-market software.
However, my thesis leaned into two foundational realities:
Unrivaled Workflow Durability: Constellation’s portfolio operates mission-critical software with deep operational lock-in.
Accelerating Forward Earnings: While the market voted emotionally on sentiment, underlying earnings were forecasted to accelerate sharply over the coming years.
Valuation Dislocation: A Generational Entry
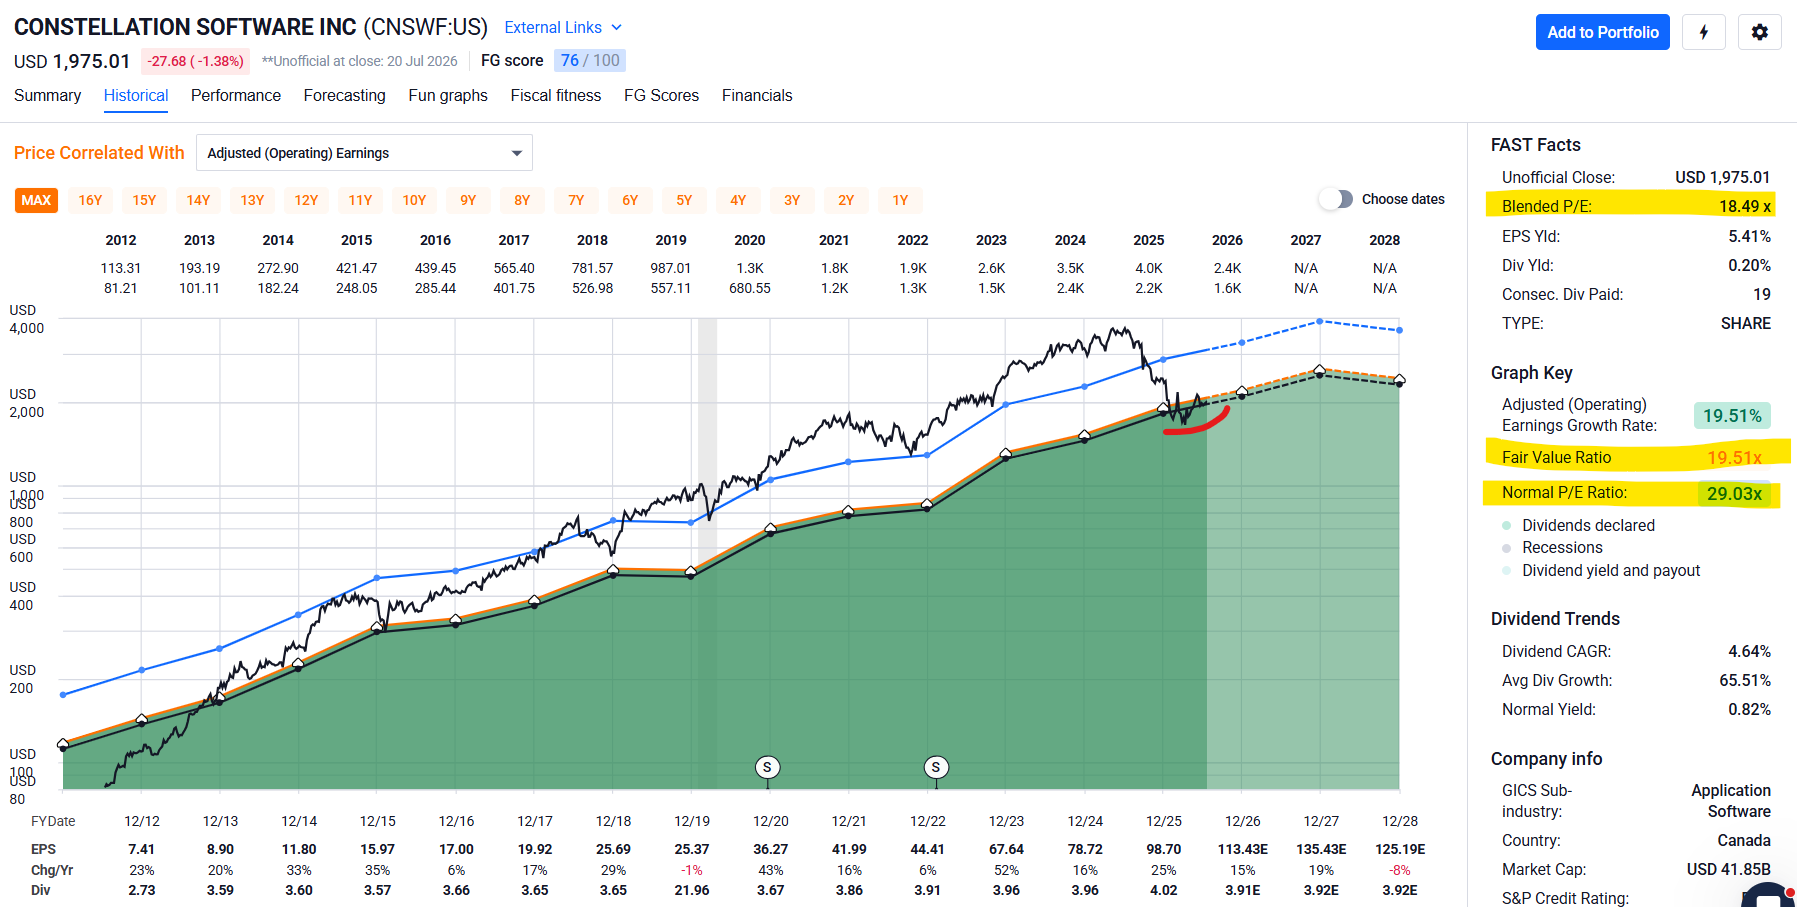
At the time of my accumulation alert, FAST Graphs data highlighted a severe valuation dislocation:
Blended P/E Ratio: 18.49x (a dramatic contraction from its historical normal P/E of 29.03x and fair value baseline of 19.51x).
Historical Context: Shares were trading notably below the valuation floors established during the depths of the 2020 COVID-19 crash, creating an exceptionally rare valuation gap relative to its multi-decade compounding rate.
Tools That Make It Easier
FAST Graphs is outstanding for reviewing fundamentals trends. Their visual format helps you quickly spot undervalued or overvalued stocks, making it far easier to interpret than long tables of raw data.
I’ve partnered with FAST Graphs to extend a 25% discount on subscriptions. Use my discount code: AFFILIATE25.
Tools That Make It Easier
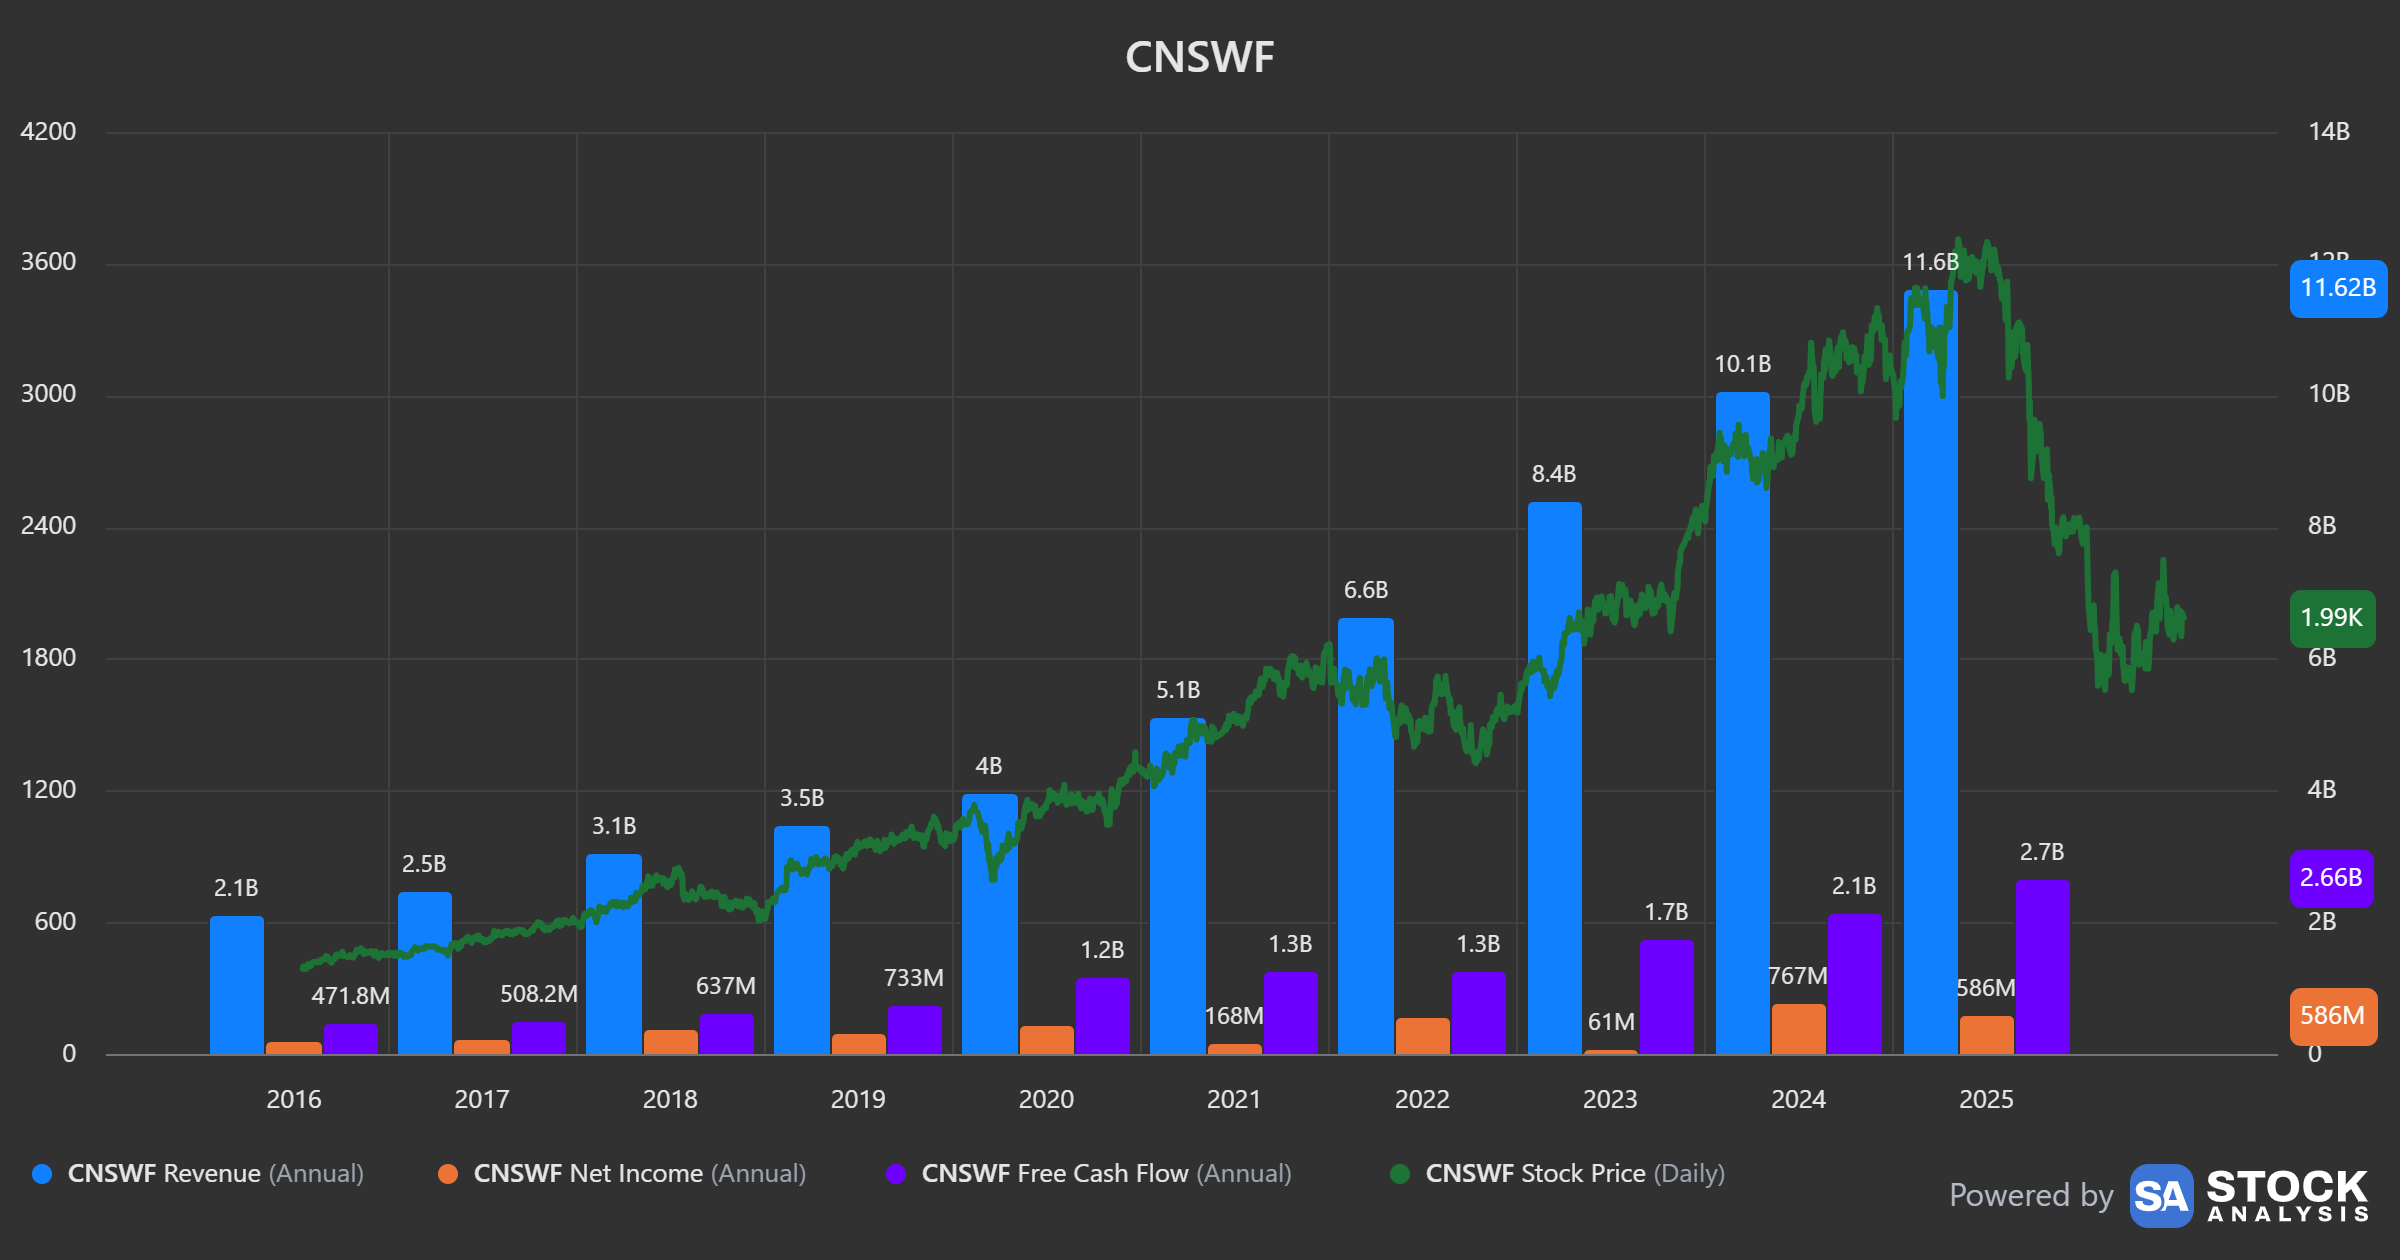
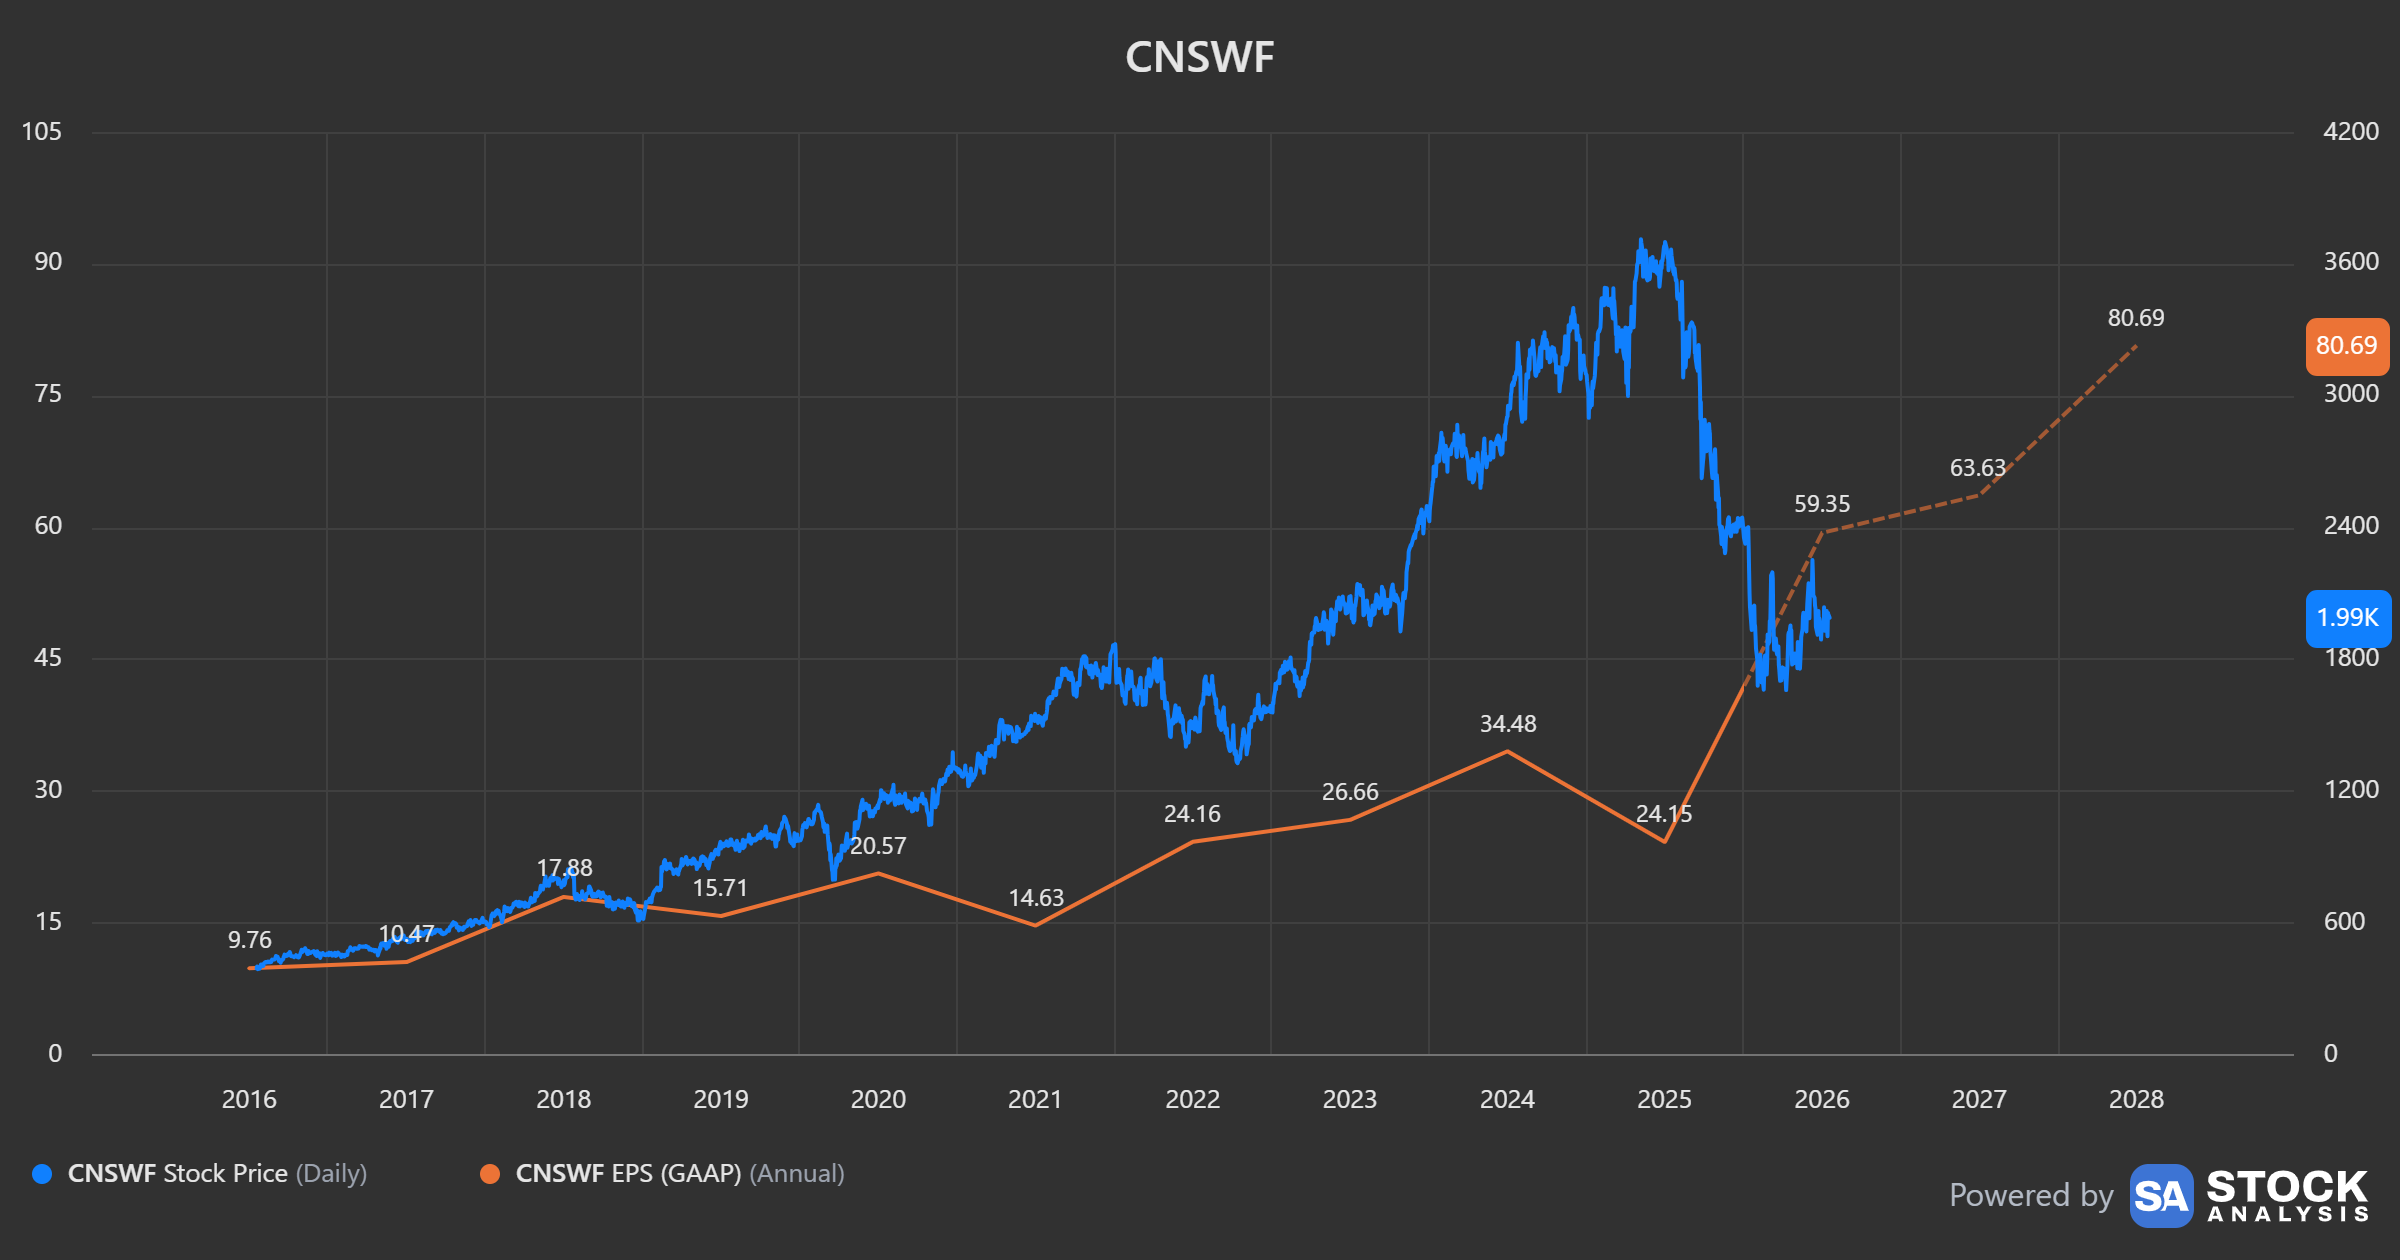
StockAnalysis is one of the most intuitive tools for reviewing fundamentals, trends, and key performance metrics.
I’ve partnered with StockAnalysis to extend a 10% discount on subscriptions for my readers. If you value clear financials, intuitive charting, and access to reliable KPI data, it’s a worthy addition to your research stack.
Use my discount code: LEX.
👉Stockanalysis.com
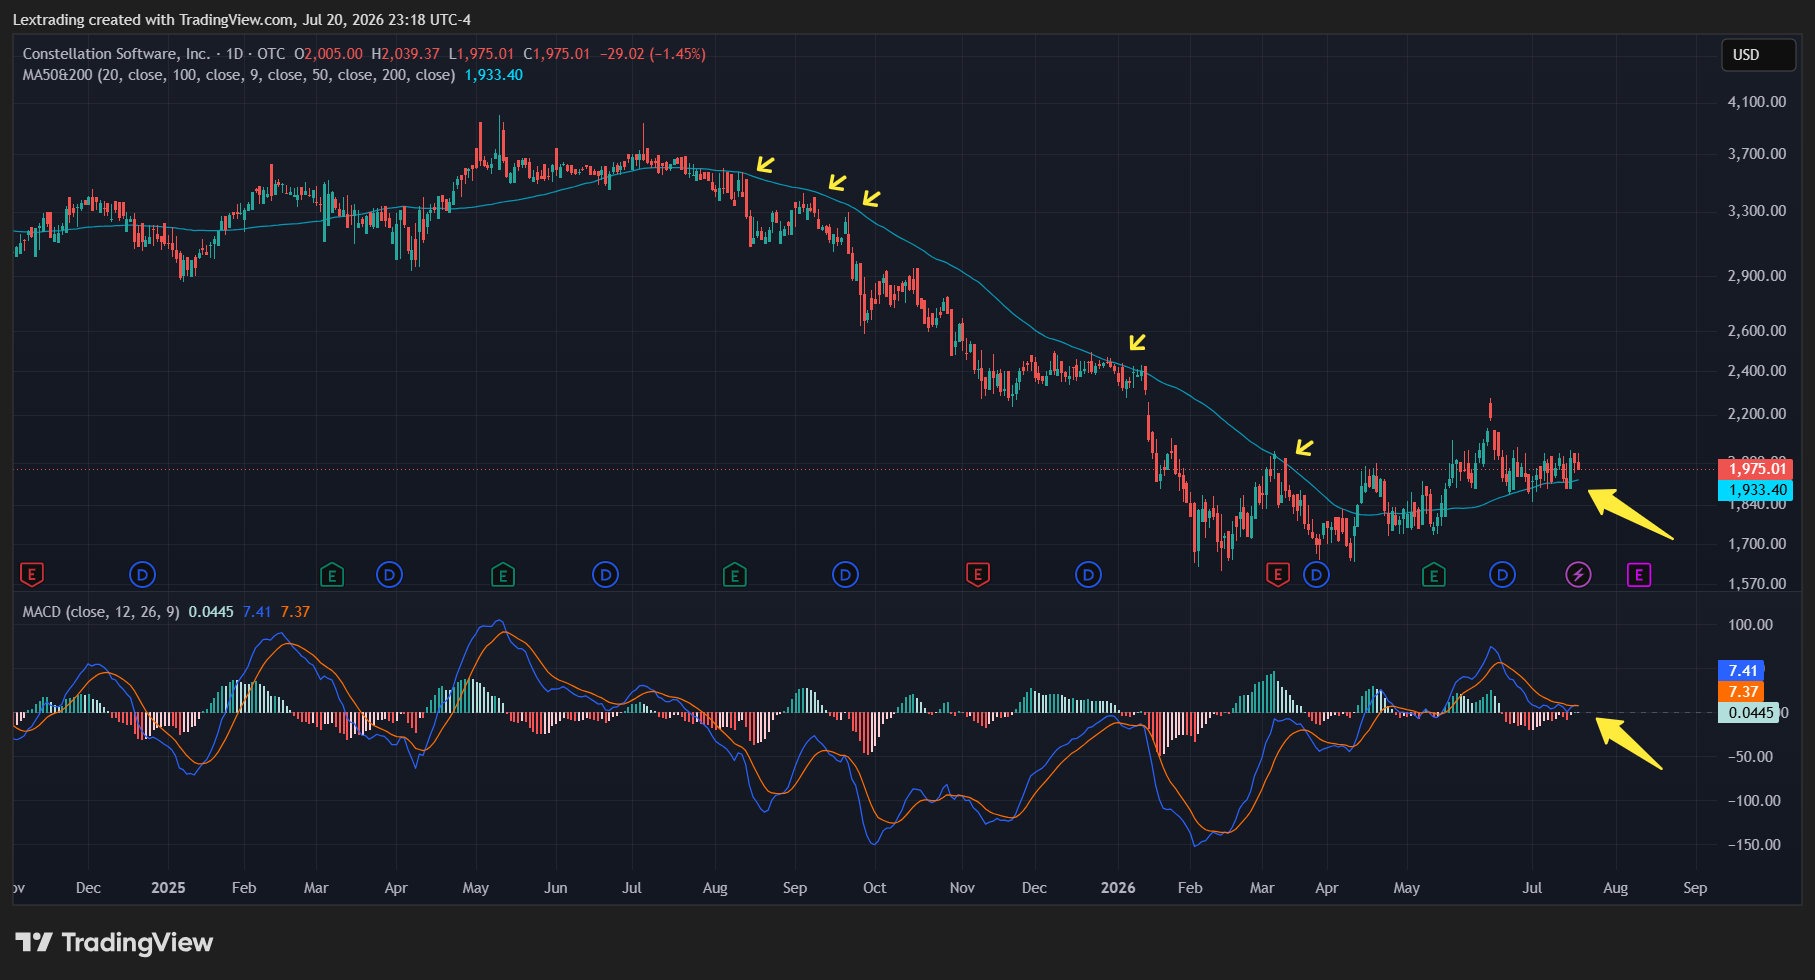
From a technical perspective, I identified early signs of structural mean-reversion when price action reclaimed and closed above its 50-day moving average. This 50-day MA had served as a relentless dynamic resistance ceiling, systematically capping every relief rally throughout the prolonged drawdown since August 2025. Additionally, the MACD was on the cusp of crossing over.
Current Technical Blueprint & Execution
Since issuing that alert, price action has unfolded exactly as anticipated. The stock bounced sharply off the 50-day moving average, delivering >20% ROI from my initial entries.
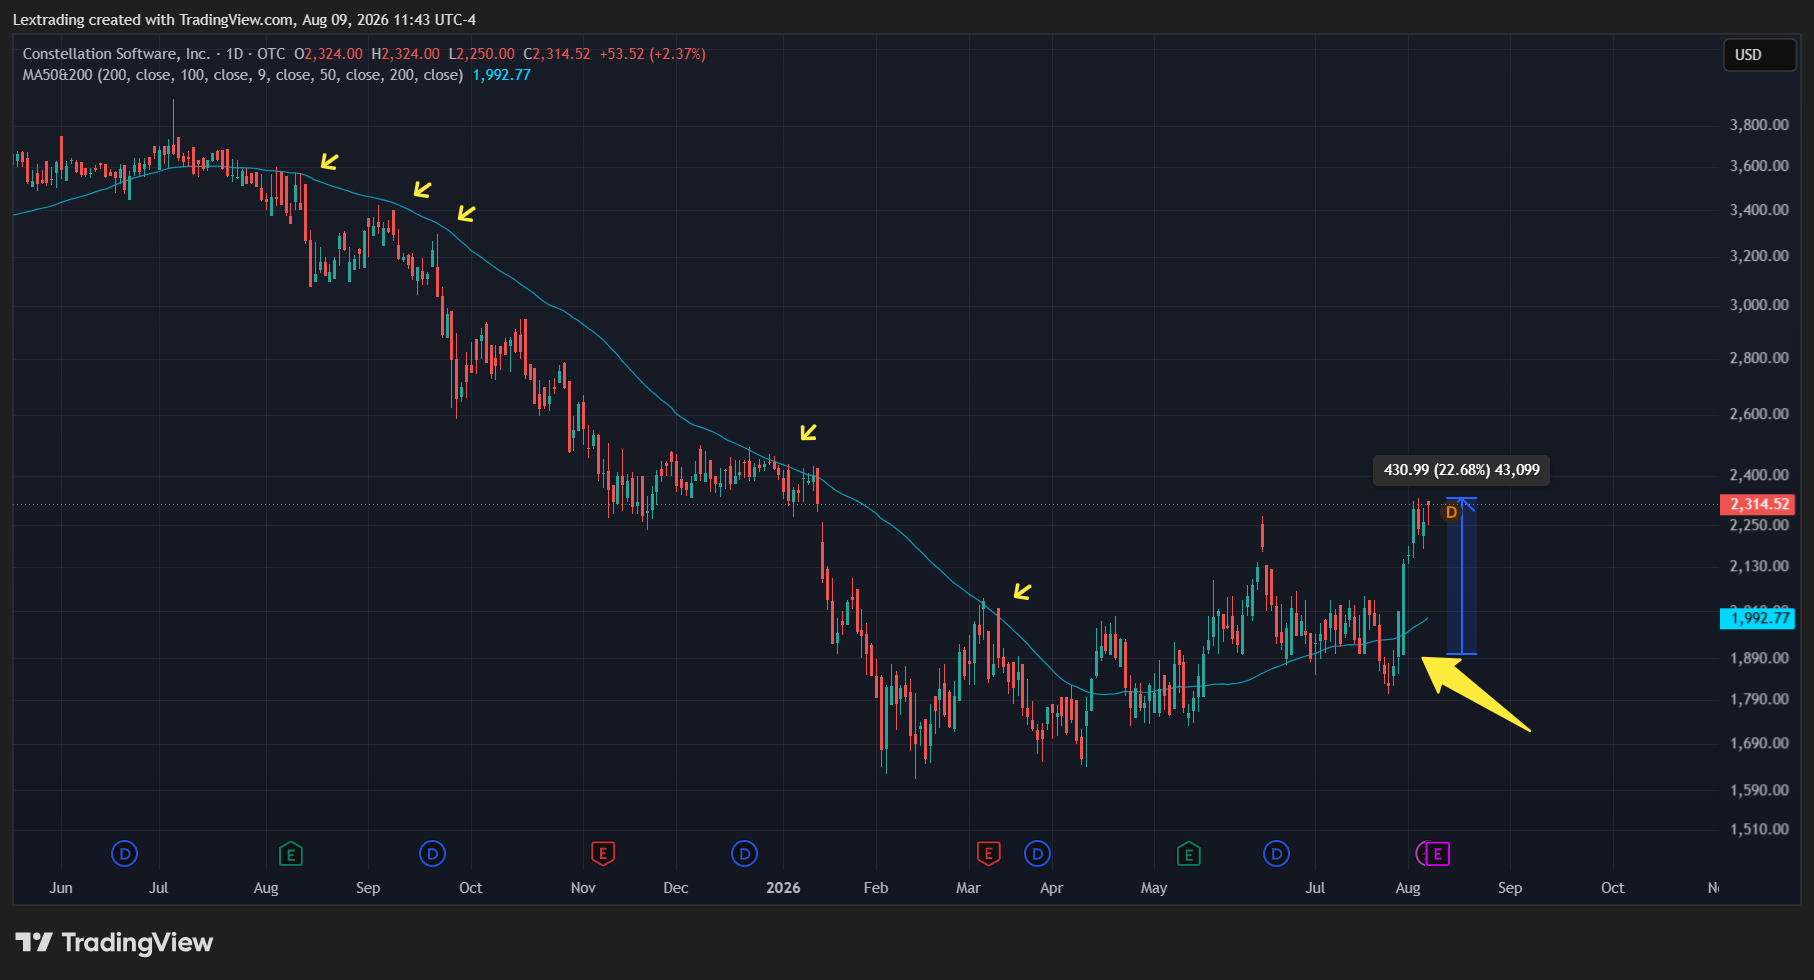
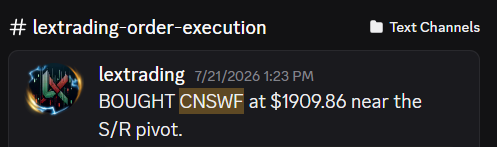

As the equity advances off its structural floor, now is the opportune time to review the weekly chart as price approaches its next major resistance confluence:
